


Table of Contents
What is statistical significance?
Statistical significance for CRO is the measurement of the probability of the null hypothesis being true in comparison to the acceptable level of doubt or uncertainty.
Or in simpler terms the likelihood of an event not being down to chance alone.
Why is it important?
Statistical significance is important in reducing the risk of random chance.
For instance if you were to flip a coin, the chance of the coin landing on heads is 50%. However if you were to flip a coin twice, the chance of generating the same result reduces to 25%. This reduces to ⅛ after 3 times.
The more times we flip the coin the more the result is not based on random chance. This logic functions very much in the same way with a/b testing within CRO and experimentation teams, with all tests attempting to reduce chance & to find out if a variant of design change has benefited the customer, business or both over a given period of time.
Typically most marketers run tests to 95% statistical significance, however this is only a metric to gauge an individual’s appetite for risk. Normally, the higher the statistical significance, the larger the sample size, or longer a test is required to run in order to achieve the level of statistical significance required. Alternatively, the larger the change between control and variant, lower the sample size required, as the likelihood of chance has been removed.
How do you calculate statistical significance?
A hypothesis must be established before deciding whether a test can be deemed as statistically significant.
- Determine the significance level that the team or business is happy with. For the most part, statistical significance is delivered in percentage terms i.e 90%, 95% or 99% however can also be shown as 0.10, 0.05 or 0.01 to reflect the same risk respectively.
- Launch your a/b test and start collecting data. You can either do this through the a/b testing platform or by connecting your data into an analytics tool such as GA4.
- Calculate your hypothesis by finding your p value.
(The P-value is used to determine which hypothesis the data has supported)
z = ^p−p0 / √p0(1−p0)n
^p = Sample population
P0 = assumed population proportion in the null hypothesis
N = sample size
- If your result is below 0.05, this generally means that your test has been statistically significant.
A working example.
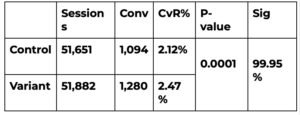
In the example below, we can see that the control converted at 2.12%. The variant with the design change, converted at 2.47%. This was a 16.48% increase in conversion rate and an additional 186 conversions in-test. Therefore our calculated p-value is 0.0001. This suggests that it is extremely unlikely that the scenario was based on chance alone and therefore, likely to have a perceived impact on the CRO performance of the website.
The difference between frequentist and bayesian calculations
When it comes to statistical reference, there are two approaches which CRO marketers can take. These are the Bayesian or Frequentist approaches. The Frequentist approach assigns probabilities to the data and not hypotheses. Whereas Bayesian assigns assumptions to the hypothesis, therefore the above methodology is based on a Bayesian approach to data.
Bayesian models use prior information and data, incorporating them into the analysis, and update probabilities as more data becomes available. Whereas Frequentist approach to statistics that makes predictions on the underlying truths of the experiment from the current data from the experiment.
For example, the frequentist approach on a coin toss would expect a 50% chance of heads or tails, whereas a Bayesian approach would evolve towards a result based on past information, so if heads was the result the last 1,000 times, we would expect heads again.
Misconceptions of a statistically significant result:
- “Because in-test we saw a 16.48% uplift in conversion rate we will see the same once deployed”. This is sadly not the case, the experiment and statistical significance tells us that we expected that the change was not by chance, was intentional and is likely to improve conversion rates but not by the same amount as generated before. This number could equally be higher or lower than before.
- “Statistical significance of 95% means that I can stop my test”. This is normally the case, however it’s not down to meeting a metric. It’s because we are happy with the appetite for risk for the specific change in the experiment. For instance, we can change the colour of a button because we know that it is not likely to reduce conversion rates.
- “Statistical significance can change daily”. This is also true due to differences in the data, one day a test can be ‘winning’ whilst another day it will be ‘losing’. However what is important to complete is pre-test analysis, determining how long you want or expect the experiment to run for and then running your calculations at such a date. However, it can be better to share the % increase with client over the course of the experiment.
Post-Test Validation and Continuous Optimisation
After achieving statistical significance and implementing the winning variant, it’s crucial to monitor the long-term effects of the change. Conversion rates can fluctuate over time due to user behaviour, seasonality, or changes in external conditions like marketing efforts. A successful test should be followed by continuous tracking and optimization to ensure the initial results hold. Additionally, running post-test validations helps detect regression or unintended consequences, ensuring your CRO strategies are both effective and sustainable. Iterative testing and analysis will lead to better user experiences, enhanced business outcomes, and a more data-driven decision-making process.
If you would like to know more about CRO and experimentation at Modo25 get in touch with our team of specialists at cro@modo25.com.
